
[Table of contents]Show table of contents
Across 80+ audits: the average company identifies 3 out of 11 real bottlenecks. The rest stay invisible because that’s just how things have always worked. Processes nobody has questioned in five years, because nobody remembers it can be done differently.
Process Mapping Method isn’t theory from a textbook. It’s a tool pulled out of 80+ projects for companies of 20-500 people — from premium dealers to FMCG distributors. We always start the same way: hunting for the work that doesn’t show up on the org chart.
Types of process bottlenecks
Five repeating patterns. Each has its own signature, its own cost, its own payback. The order isn’t random — cheapest to root out at the top, most expensive at the bottom.
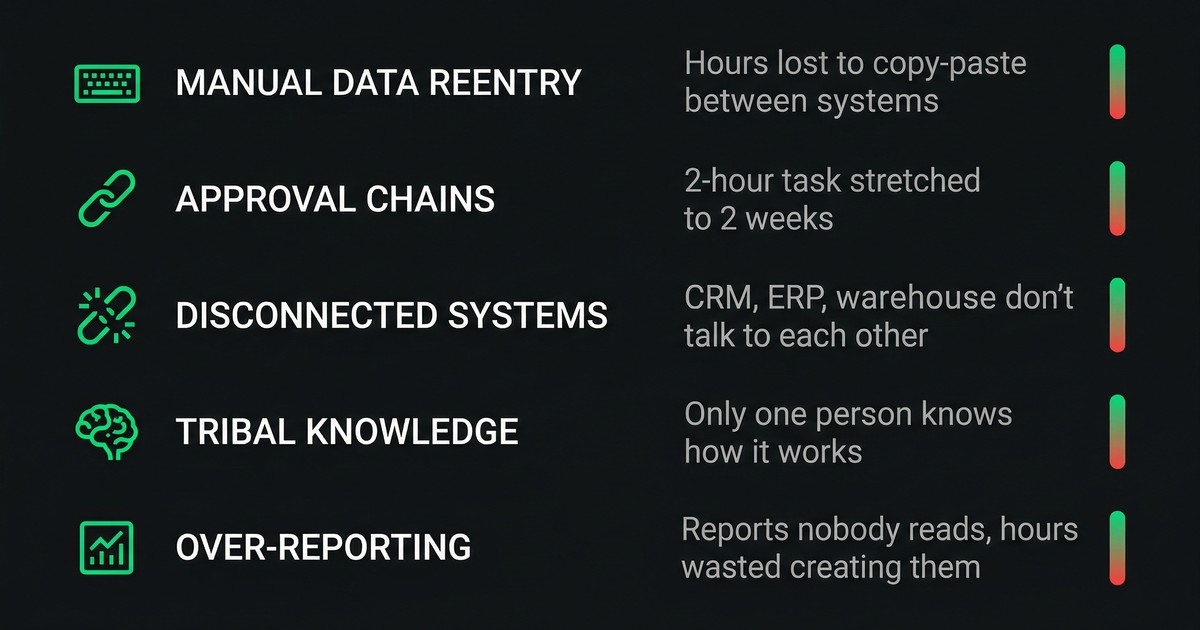
Type 1: Manual data entry
Manual data entry. 200 invoices/month x 8 minutes = 27h/month, 3.3% error rate, one full-time hire effectively employed just to retype numbers from PDF into the ERP. Email parser, 3 days to build. ROI in 6 weeks. At a premium dealer group we identified 14 points of manual data transfer. Eliminating 11 of them, mainly through process automation, saved 23 man-hours per week.
Type 2: Approval chains
An order needs sign-off from a manager, then a director, then the CEO. Each stage is 1-3 days of waiting. A two-hour chain stretched into two weeks. The fix isn’t killing the approvals. It’s automating the routing and setting amount thresholds above which the CEO’s signature actually matters.
Type 3: Disconnected systems
CRM doesn’t talk to ERP. ERP doesn’t talk to the warehouse. The warehouse doesn’t talk to accounting. Every system has its own “truth,” and people are the glue syncing that truth by hand, every day, with errors. This is the most expensive bottleneck type because it generates not just wasted time but data discrepancies that drive bad executive decisions a quarter later.
Type 4: Tribal knowledge
Janek in the warehouse is the only person who knows the German return scenarios (special VAT). Janek calls in sick. Process halts. Janek leaves. The knowledge walks out with him. Automation in 2 weeks, cost 8k. VAT rules encoded in the workflow, documentation in Confluence, EU VAT number parser with VIES verification. Ania in accounting had the same story with credit notes from Supplier X — today a junior handles it after a week of onboarding.
Type 5: Over-reporting
The team spends 15 hours a week on reports the board reads 20% of. Reports generated manually, in Excel, with data copied from three systems. Nobody asks whether the reports are needed, because “we’ve always done them.” At one company we cut 7 out of 12 reports with zero impact on board decision-making. The remaining 5 went into an automated dashboard refreshed every 4h.
Case study: Inter-Auto
Inter-Auto, 6 locations, 47 processes audited. 14 points of manual data transfer. Each one a 3-5% error rate. Fix: invoice-scanning integration with the DMS. Cost 45k. Payback 8 months.
The problem sounded different from how it looked in the first meeting: “we’re growing but we can’t hire administrative staff proportionally.” After the audit it turned out administration wasn’t the bottleneck. The bottleneck was the data flows between dealerships and HQ, which generated administrative work nobody had planned for.
Biggest findings: 14 manual re-keying points (Type 1), a warranty-repair approval chain taking 9 days instead of 2 (Type 2), three disconnected systems — DMS, CRM, and the service system (Type 3). Total savings after rollout: 67 man-hours a week and four administrative roles eliminated (staff moved into customer-facing positions, zero layoffs).
How to calculate ROI for process optimization
The dealer paid 45k for the invoice-scanning integration with the DMS. In month 2 the system caught a misentered VIN that would have rolled through to a 120k PLN warranty claim. The integration paid for itself in one bug-catch — before any of the hourly savings that were supposed to be the actual reason for buying it.
That’s the right way to model ROI: not just (time saved x hourly rate), but avoided error cost x frequency. For the dealer group in year one: 67h x PLN 85 x 48 weeks + 1,200 errors caught x PLN 280 = PLN 609,360 against a PLN 420k implementation. ROI 145% in year 1, 340% in year 2 with cumulative effect and amortization of the implementation cost.
30-day optimization sprint
Week 1: Mapping
We interview the people, not the managers. The sales rep shows the real workflow: email → Slack screenshot → copy into Excel → dig through 2022 archives for old deals. The shadow flow doesn’t exist on the org chart. But that’s where the real work happens, that’s where the real losses are, that’s where the bottlenecks nobody reports live — because it’s embarrassing. Output: a process map with bottlenecks labeled by type.
Week 2: Prioritization
We score each bottleneck on two axes: cost (how much does it cost the company annually?) and elimination difficulty (how much time/money does the fix take?). We start with Quick Wins — low elimination cost, high savings. They deliver fast ROI and build momentum in an organization whose last 3 “improvement” initiatives ended in a presentation with no rollout.
Week 3: Quick Win implementation
Automations, integrations, simplified workflows. Typical Quick Wins: automatic order import from emails, CRM-ERP integration via API, a dashboard replacing 5 manual reports. Every Quick Win has to deliver a measurable result within 7 days of deployment. If it doesn’t, it wasn’t a Quick Win — it was a project, misclassified.
Week 4: Roadmap and measurement
We compare metrics before and after. We build a roadmap for the deeper changes (system integrations, migrations, new tools) with a timeline and budget.
If they become dependent on us, we’ve failed. Success looks different: they spot the next bottleneck themselves, run the first cost analysis themselves, and only call us in to build the fix. A client a year later calling once a quarter with a specific scope beats a client on retainer who doesn’t know exactly what they want to change.
FAQ
What are the 5 types of process bottlenecks?
Manual data entry (3-5% error rate), approval chains (a 2-hour process stretched to 2 weeks), disconnected systems (people acting as glue between CRM/ERP/warehouse), tribal knowledge (knowledge living in one person’s head), over-reporting (15h/week on reports read at 20%).
How do you calculate ROI for process optimization?
ROI = (hours saved x hourly rate x 48 weeks + errors avoided x cost per error) / implementation cost. The second term often outweighs the first — a single caught error can cover the whole integration, as it did with Inter-Auto and the 120k warranty claim caught in month two.
What’s the cost-benefit of automating manual data entry?
Real example: 200 invoices/month x 8 min = 27h/month plus 3.3% errors. Email parser with OCR: 3 days to build, 6 weeks to full payback. Over a year: 324h saved plus tens of thousands of PLN in error elimination.
How long does process optimization take?
A 30-day sprint for the map + Quick Wins + roadmap. Deeper integrations take 3-9 months depending on the number of systems and API quality. First measurable savings in week 3, full ROI in year 1, cumulative effect in year 2.